

In 2016, I started a monthly article commenting on US economic data called Economics Speed Round. Though I ended up retiring the format this year, since monthly data tends to be so volatile in the short-term, I remained interested in commenting on the economy and the political climate that surrounds it. To that end, I introduce The Economic Quarterly, which will focus on economic data by quarter on a longer 15-year mean and 4-year trend perspective that will ideally allow comparisons of economic climates between previous administrations. This should allow for a broader view of the economic data and better illustrate the impact different governing ideologies have on markets and the economy.
So, without further ado…
GDP GROWTH DATA
The GDP Growth Rate for 2016 Quarter 4 was officially 2.1%, per the third estimate from the Bureau of Economic Analysis. This puts it just above the 15-year mean, which includes the 2007-2008 recession, but below (not shown) the non-recessionary mean. The 4-year trend from 2013 through Quarter 4 of last year shows a slight downward trend, though 2013 and 2014 were the strongest economic years of Obama’s 8 years in office, and the economy cooled off considerably in 2015 and 2016. Presently, the 1st Quarter forecast is a solid 2.5% GDP growth, however poor initial job numbers for March may reflect a possible slower GDP growth at the end of Quarter 1.
GDP Growth Rate – 15-Year (1/1/2002-4/7/2017)

GDP Growth Rate – 4-Year Trend (4/1/2013-4/7/2017)

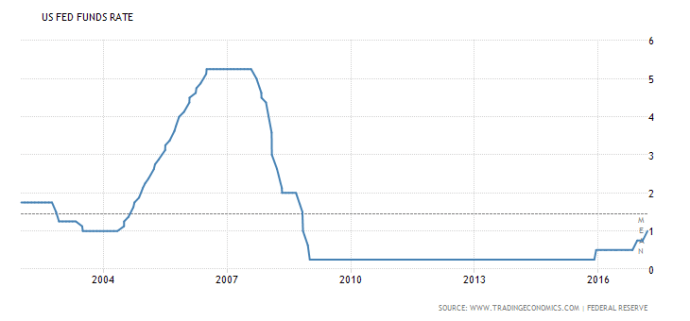
FEDERAL FUNDS RATE DATA
The Federal Reserve announced another interest rate hike, bringing the Federal Funds Rate to a full percentage point for the first time since the end of 2008. This move reflects a series of positive moves that date back to the end of 2016, though the Fed had been making noises about raising the Federal Funds Rate as far back as 2015. At 1.00%, it is still at a historically low level, far below its peak of 5.25% in 2006-2007, and well below the 15-year mean. The Interbank Rate is at 1.16%, which is also pretty well below the 15-year mean and has been creeping upward since early 2016.
Federal Funds Rate Rate – 15-Year (1/1/2002-4/7/2017)
Interbank Loan Rate – 15-Year (1/1/2002-4/7/2017)

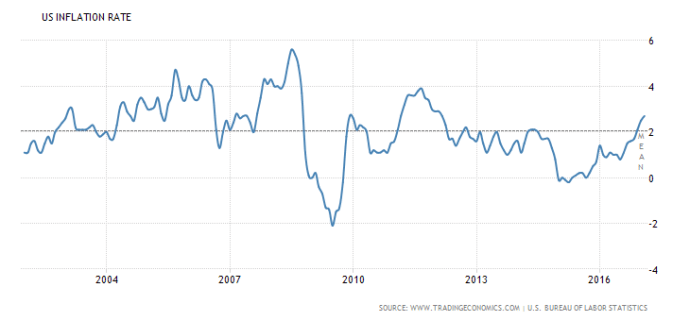
INFLATION RATE DATA
Inflation has climbed above the 15-year mean to 2.7% and has been moving steadily upward since 2015, with only a slight hiccup in the first two quarters of 2016. It is still well below the rates seen in 2005-2006 or the hot market leading to the crash in 2008. The last time the inflation rate began climbing like this was in the presidential election year, 2012, cooling off rapidly after Obama’s reelection.
Inflation Rate – 15-Year (1/1/2002-4/7/2017)
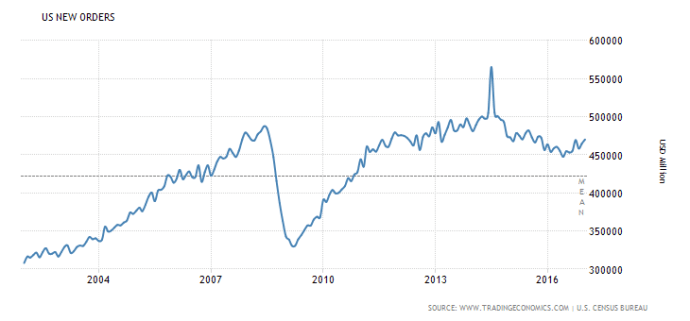
CAPITAL GOODS NEW ORDERS (Non-Defense) DATA
New Orders of capital goods is above the 15-year mean, but measurably below the heights of 2013 to 2014, and even 2015. There has been an upward trend since mid 2016, however, fairly in line with the up tick in Labor Force Participation.
Capital Goods New Orders – 15-Year (1/1/2002-4/7/2017)
JOB NUMBER DATA
The jobs numbers for 2016 Quarter 4 totaled 443,000 net jobs. Compared to 716,000 net jobs in 2016 Quarter 3 and 832,000 jobs in 2015 Quarter 4 a year prior, so job numbers in Q4 were considerably lower. The job numbers for 2017 Quarter 1 totaled just 533,000, as of the preliminary numbers for February, which were revised downward, along with January, and for March. The March numbers of 98,000 jobs is the third time job numbers have dropped below 150,000 mark in last calendar year. It should be noted that annual net jobs have been on a downward trend since 2014, where they peaked at 2,998,000 jobs for the year.
Job Numbers – 4-Year (1/1/2013-4/7/2017)

LABOR FORCE PARTICIPATION RATE DATA
The Labor Force Participation Rate (LFPR) remains at historic lows, hitting its lowest level at 62.4% in September of 2015. This number, which had been at a record high as recently as 2000-2001 at 67%, slid slightly after the 2001 terror attacks but stabilized and was climbing until 2008. From 2008 until the end of 2015, the LFPR dropped 3.5% as older workers retired, experienced workers lost their jobs, and younger workers found few available jobs in their fields. The 4-year trend continues to show a decline, though the trend has been positive since April 2015 (not graphed).
Labor Force Participation Rate – 15-Year (1/1/2002-4/7/2017)
Labor Force Participation Rate – 4-Year (4/1/2013-4/7/2017)
GOVERNMENT DEBT TO GDP DATA
Finally, a stat that used to be an important conservative political point, but has since dropped off of the political radar, the National Debt to GDP ratio. As of 2012, the National Debt exceeded 100% of the GDP and has not been below 100% since. The last official number for the debt was at $19,959,594,000,000.00, which is technically over the 104.17% Debt to GDP number from 2015 and growing.
Debt to GDP – 4-Year (4/1/2013-4/7/2017)

THE READ
The economy has been moving upward since about 2015, but, from a purely political standpoint, much of this growth could be attributed to the general impression that the political winds were going to change in Washington. Much of the capital that’s been sidelined for much of the Obama administration was starting to move back into the market as it became clear the GOP was assured a political victory in 2016. The primary concern for these investors was ObamaCare, which has been a dead weight around the necks of American companies since its passage in 2010, even before the serious negative economic impacts of the legislation went into effect.
As consensus that a GOP “Repeal and Replace” bill was a foregone conclusion, since Repeal measures have repeatedly passed Congress several times before, the only question employers had was what would the new legislation look like, not if it would pass. With the build up and infighting that was sparked almost as soon as the ill fated American Health Care Act was announced at the beginning of March had to cool the expectations of success, even though the total failure of the GOP to deliver on its single unifying political purpose didn’t come until the end of the month.
So the question is, how hot did the the economy get in expectation of the GOP’s move to kill ObamaCare and how much did the economy get chilled after it became clear that there wasn’t a lot of support for the plan the GOP had cobbled together? Does the economy keep its gains made over the last campaign year, now that the central expectation of that political year is back at square one, or do industries walk back their bulking up in expectation of political gridlock in Washington over ObamaCare’s future. If the capital flows out to sea again, so to speak, it won’t come back in until after some sort of clear consensus is found on the job killing ObamaCare.
Look for markets to be split on the question. Some larger players will likely carry the load, expecting some sort of action in the next calendar year. Other players, especially those that can’t carry the extra expense that comes with additional hiring, will likely cut payrolls either through layoffs or reduced hours to run leaner until Washington moves. If the GOP can’t deliver the end of ObamaCare while in control of both halves of Congress and the White House, look for serious downturn potential as markets will have to play defensive in the mid-term. The weak 98,000 net jobs created in March, blamed partly on inclement weather, is also likely from uncertainty over the AHCA misfire.
Taking all of this into consideration, I’m calling bear. I believe the weaker than expected job numbers reflects employers tapping their brakes on growth expectations. Look for the inflation number to cool off as well. I expect the GDP Growth Rate to miss the 2.5% target, though the number may look good with the initial estimate, which will be based on data from January and February, when hopes for action on ObamaCare were higher, with March data cooling that number down by the time the second and third estimates roll out in May and June.
This has been the Liberty Is For The Win Economic Quarterly. Catch you all in a few months.
Liberty is For The Win!


