

GDP GROWTH DATA
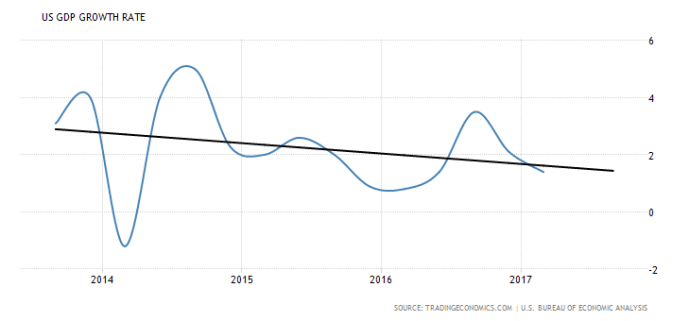
The GDP Growth Rate for 2017 Quarter 1 was officially 1.4%, considerably below the 15-year mean, which includes the 2007-2008 recession that makes that number considerably easier to beat. The 4-year trend from 2013 through Quarter 1 of this year continues to show a downward trend, though 2013 and 2014 were the strongest economic years of Obama’s 8 years in office, and the economy has cooled off considerably since. The Q1 number missed the forecasted number of 2.5% considerably, which proved my concern that poor initial job numbers for March, which have since been revised down even further to 50,000, reflected slower GDP growth in Q1.
GDP Growth Rate – 15-Year (1/1/2002-7/7/2017)

GDP Growth Rate – 4-Year Trend (7/1/2013-7/7/2017)
FEDERAL FUNDS RATE DATA
In June, the Federal Reserve announced yet another interest rate hike, bringing the Federal Funds Rate to 1.25%. While still at a historically low level, far below its peak of 5.25% in 2006-2007, and well below the 15-year mean, the Fed seem intent on driving up the Funds Rate as quickly as they can while somewhat positive trends continue. The Interbank Rate is at 1.30%, which is also pretty well below the 15-year mean and has been creeping upward since early 2016.
Federal Funds Rate Rate – 15-Year (1/1/2002-7/7/2017)

Interbank Loan Rate – 15-Year (1/1/2002-7/7/2017)

INFLATION RATE DATA
Inflation has cooled down to 1.9% from its high of 2.7% in February and is back below the 15-year mean. Though it remains above the mean since January 2016 (not shown), the trend downward could reflect either a trend down in the market itself or the market’s reaction to a tightening money supply, however, the Fed Funds rate still being very low makes the latter highly unlikely. Regardless, the rate is still on an upward trend since at least 2015.
Inflation Rate – 15-Year (1/1/2002-7/7/2017)

CAPITAL GOODS NEW ORDERS (Non-Defense) DATA
New Orders of capital goods remains above the 15-year mean, but decreased in March in a reflection of the slowdown in the economy in Q1. There has been an upward trend since mid 2016, however, fairly in line with the up tick in Labor Force Participation.
Capital Goods New Orders – 15-Year (1/1/2002-7/7/2017)

JOB NUMBER DATA
The jobs numbers for 2017 Quarter 1 totaled 498,000 net jobs, down from the initial Q1 estimate of 533,000, compared to 443,000 net jobs in 2016 Quarter 4 and 588,000 jobs in 2016 Quarter 1, so job numbers in Q1 were a mixed signal. The job numbers for 2017 Quarter 2 totaled 581,000, as of the preliminary numbers for just released yesterday. Presently, Q2 seems to be on track to be slightly below the 4-year average of 210,000 monthly jobs, with the 150,000 May numbers dragging it down, even though the 222,000 jobs (preliminary) in June are on the mark for the 4-year median.
Job Numbers – 4-Year (1/1/2013-7/7/2017)

LABOR FORCE PARTICIPATION RATE DATA
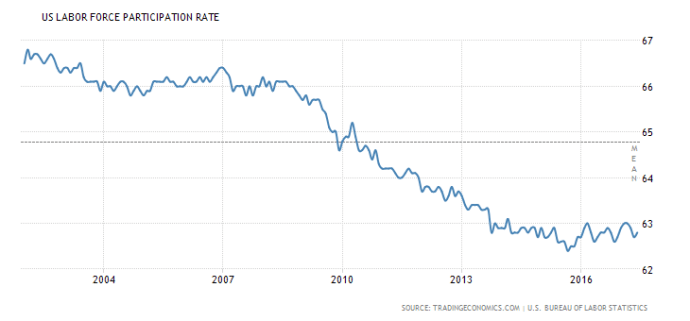
The Labor Force Participation Rate (LFPR) continues to a recent positive trend since April 2015 (not graphed), climbing to 62.8% in June. The LFPR remains at historic lows, however, far below the 15-year mean, with no indication of any increases in the near future. The 4-year trend remains negative with very slow recovery.
Labor Force Participation Rate – 15-Year (1/1/2002-7/7/2017)
Labor Force Participation Rate – 4-Year (4/1/2013-7/7/2017)

GOVERNMENT DEBT TO GDP DATA
Finally, the National Debt to GDP ratio climbed to 106.10% at the end of 2016. There isn’t any data from 2017, but we should have some indication by the next Economics Quarterly for the first part of this year. Most people reading this will understand what this means, for those that don’t, however, presently the federal debt load is more than all of the wealth that the entire US economy generates in a year. This does not include future obligations (such as Medicare and Social Security).
Debt to GDP – 4-Year (4/1/2013-7/7/2017)

THE READ
The read from the previous Economics Quarterly was bearish, and I remain so. The Q1 GDP Growth was considerably lower than the market was predicting, but was in line with a market pumping its brakes through March. Republicans suggest that a lot of this slow down was from inclement weather in the North East, but there really wasn’t that significant an interruption of the economy, having caused days of disruption, not weeks. The biggest news of March was the failure of the GOP American Health Care Act “Repeal & Replace” legislation.
More than a few economic hopes were pinned on a Republican Party that’s done nothing but promise “Repeal” for 7 years, and their failure to overcome their own party’s concerns threw cold water on a lot of people’s expectations. Since then, of course, the House finally did push through a slightly modified plan, moving the ball to the Senate where partisan obstacles are even higher. With the Senate plan falling apart in the last week, Republicans are now forced to figure out a new direction.
GDP Growth in Quarter 2 will be stronger than in Quarter 1, but don’t look for any doors to be blown off the hinges. A GDP number of 2.5% to 3.0% is possible but seems very unlikely given other factors in the economy. The rising Fed Funds Rate will cool off the money supply some. The Inflation Rate has cooled down 3 months in a row, and the Core Inflation Rate (not graphed) has cooled off 4 months in a row. Coupled with both a drop in orders of Capital Goods and passable Job Numbers, including a relatively bland number in May, all the stumbling blocks are in place for a brief to moderate correction.
The economy has been expanding for about 5 to 6 years, depending on where the recovery is scored. I believe that ObamaCare is keeping the economy from heating up too much, acting as a heavy tax on the economy, but the steep increase in the Inflation Rate that began in late 2014, early 2015, is pushing is sign that the economy is having trouble finding places to move capital effectively. That indicates that a pull back is imminent, because the market is over priced right now. I believe that this, more so than the very moderate Inflation Rate, is driving the Fed to push up the Federal Funds Rate at such an unusually steep rate.
That’s my read. Be cautious.
One more thing, a lot of noise has been made in the news lately from Republicans about numbers they’ve randomly taken from the political cycle that they flaunt without any benefit of context. I’ll focus on two points that I found extra ridiculous. First, a few weeks ago, Republicans were flaunting “historically low” unemployment number among Black Americans, as if Donald Trump’s policies were the direct cause. This is ludicrous. Below is the unemployment rate among Blacks or African Americans for the last 10 years. Unemployment has clearly and steadily been decreasing in the Black community for years. Let’s celebrate when Black unemployment is the same as White unemployment.
Second, Republicans recently shared an article that celebrated a $22 Million cut to the Federal Budget, negotiated under the most recent Omnibus budget deal that passed Congress and was signed by President Trump in early May. To get an idea of how ridiculous touting this is, let’s compare the $22 Million cut to the 2016 budget. The 2016 budget was $3.54 Trillion, with a budget deficit of $552 Billion. That $22 Million cut represents a total of 0.000006214689265536723% cut to the 2016 budget. How much did the Republicans and Democrats cut? 0%. Nothing.
The only thing that’s clear about federal budget right now is that no one in Washington is taking the federal budget seriously. That there are people actually gullible enough to believe that $22 Million represents a significant portion of the budget is simply embarrassing and demonstrates just how uneducated in matters of the economy and the federal budget the American populace is.
This has been the Liberty Is For The Win Economic Quarterly. Catch you all in a few months.
Liberty is For The Win!


