

Americans need to have a long conversation about race, politics, and economics, but it isn’t possible with everyone sitting in two camps. One camp (the right) believes strongly that its ideology works best because cultures that have flourished and spread their influence around the world have employed political and economic ideologies of the right. The other camp (the left) believes exactly the same thing, except they believe in the political and economic ideologies of the left. Only one camp can be right.
While it may be tempting to hurl statistics back and forth, so many factors can affect statistics, and speculation abounds as to why certain classes of people suffer while others succeed. Arguing about these factors will get us nowhere, so we need to establish an objective case that can’t be dismissed out of hand. In short, we need to prove our argument the old fashioned way: democratically.
As it turns out, once framed democratically, it’s a fairly simple case to make.
ARGUMENT
Given that any population of people in a community will tend to grow geometrically over time; and given that people don’t leave a city unless the reasons they have for leaving are better than any reason they have for staying. It follows then that, in the long term, people vote with their feet. If the population increases, then obviously the citizens believed that staying was better than leaving. If the population of a city decreases, then a significant number of citizens believed that leaving was better than staying.
DATA
The time frame of this study is 50 years (basically two and a half generations), which is more than enough time for a significant amount of change (positive or negative) to be attributable to particular ideological (political and economic) cause. So, let’s look at our initial conditions, the populations of the 20 largest cities in the United States in 1960, by population:
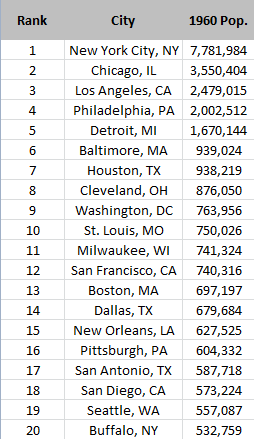
Only five United States cities had a population of over one million, the lowest of which being Detroit, MI. The political party that controls the mayor’s office reflects both the political climate of the city as well as the political philosophy of government. In the case of our study, the political control is the one thing that is different in these cities. In the last 50 years, the control of these cities breaks down like this:
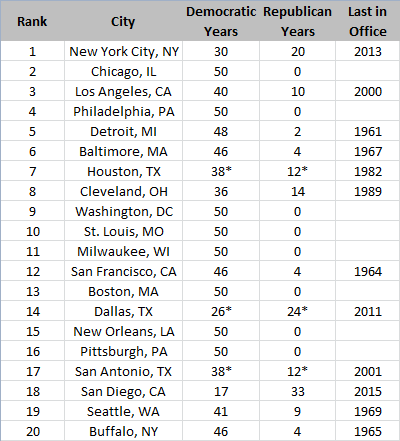 * Texas Law prohibits partisan party politics in mayoral candidates, so these numbers may change.
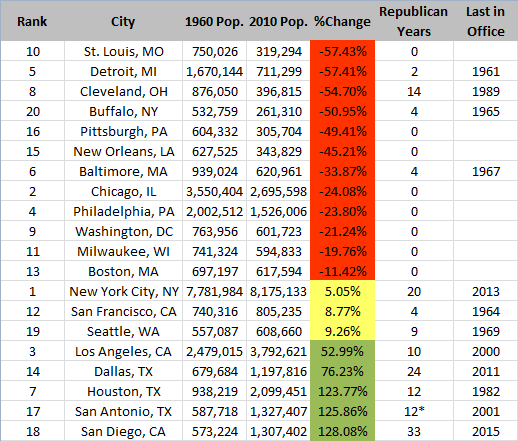
Notice that 8 of the 20 cities have had unbroken Democratic control for 50 of the last 50 years. A year for the last time a Republican politician held the mayor’s office was not included in these cases. These cities of unbroken Democratic Party domination will serve as an effective control. We know the initial conditions, and we have 50 years of political influences, so here are the results reflected in the changes in populations, in order of worst to best, along with the number of years a Republican administration was running the city:
ANALYSIS
Of the twenty most populace cities in 1960, only eight have had an increase in population. Every single one of those eight cities had a Republican administration in the last 50 years. Of the five best performing cities, four have had Republican administrations in the last 15 years. The three cities with the largest population growths, more than double population increase, had strong Republican influence in the last half century.
Of the five cities that had a population of at least 1,000,000 citizens, only four remain above that mark. Three of the five cities have had their populations decrease by a combined total of over 2,000,000 citizens. As of 2010, there are eight cities that have a population of at least 1,000,000 citizens, with the four cities newly over 1,000,000 citizens all being predominantly Republican (or right of center) politically.
Of the 8 cities in our control group (cities with 50 years of unbroken Democratic Party control), not a single one had an increase in population over the half century of this study. Of the twenty most populace cities in the United States in 1960, twelve cities decreased in population by little as 11% (Boston, MA) to as much as 57% (St Louis, MO). The four worst performing cities had a population decrease of between 50% to 57%.
CONCLUSIONS
After half a century of Democratic Party dominance of 12 of the most populated cities in the US in 1960, people have conspicuously elected to go somewhere else. Conversely, cities where Republicans have significant political influence have continued to prosper and grow for the last half century.
It’s long past time that the American left conceded that their political and economic policies not only don’t work, but people actively flee the cities in which their political and economic theories are left unchallenged and uncompromised, as is clearly demonstrated by the data. It’s time to abandon broken Utopian political theories and face the economic realities of the 21st Century.
There is room at the political table for people who care about the poor and the elderly. There is room at the political table for those who want to solve the real problems of racial discrimination and the serious economic disparities facing minority groups in the United States. There is no room for people who cling to ideologies that have demonstrably failed to deliver on their promises of equality and opportunity.
It’s time for the truth!
Liberty is For The Win!


Very nice analysis. I guess I knew most of this but I had never seen it put in a manner to grasp it easily. Thanks